Live Tracing with VisualGDB
Contents
Overview
Typical Scenarios
Targets
Creating Tracepoints
Selecting Trace Data
Viewing Trace Data
Data Views
Running via Command Line
Settings
Overview
Live Tracing is a mechanism for recording the state of the application without having to stop it in the debugger. You can set tracepoints in arbitrary locations of your program, select which data to record, and VisualGDB will patch your program to store this data in a circular buffer and immediately resume the normal flow: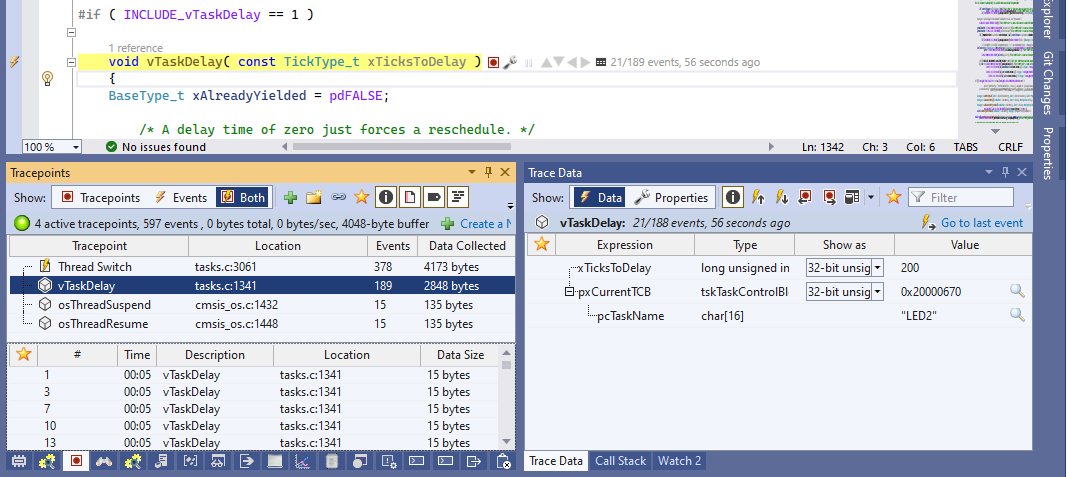 Live Tracing does not require any specialized debugging hardware (unlike J-Trace) and does not need to make changes to the source code (unlike Real-time Watch). It works by patching the existing ELF file to store data in the previously unused areas, and allows interpreting the collected data in many useful ways.
Live Tracing is supported starting from the VisualGDB Custom edition.
Typical Scenarios
Live Tracing is useful when debugging problems that happen to quickly to see in the normal debugger, happen intermittently, or involve too much data at once. E.g.:
- Recording all USB requests processed by the device
- Recording all network packets sent and received by the application
- Recording RTOS-specific events (e.g. taking/releasing mutexes)
- Recording thread switch events with precise timing
- Taking snapshots of the hardware state at critical points in time (e.g. checking the positions inside the DMA circular buffer)
- Recording all function calls (with arguments) during tests
Live Tracing can also be used for profiling (i.e. record how much time passes between different function calls).
Supported Targets
As of VisualGDB 6.0 Beta 2, Live Tracing works on ARM Cortex-M targets that support live memory reading. If Live Watch works on your ARM device, Live Tracing will work there as well.
Creating Tracepoints
In order to create tracepoints in your program, Live Tracing needs to be enabled via VisualGDB Project Properties -> Software Tracing. Once it is enabled, you can create tracepoints via the tracepoint bar (1), tracepoint annotations for functions (2), or Tracepoints window (3):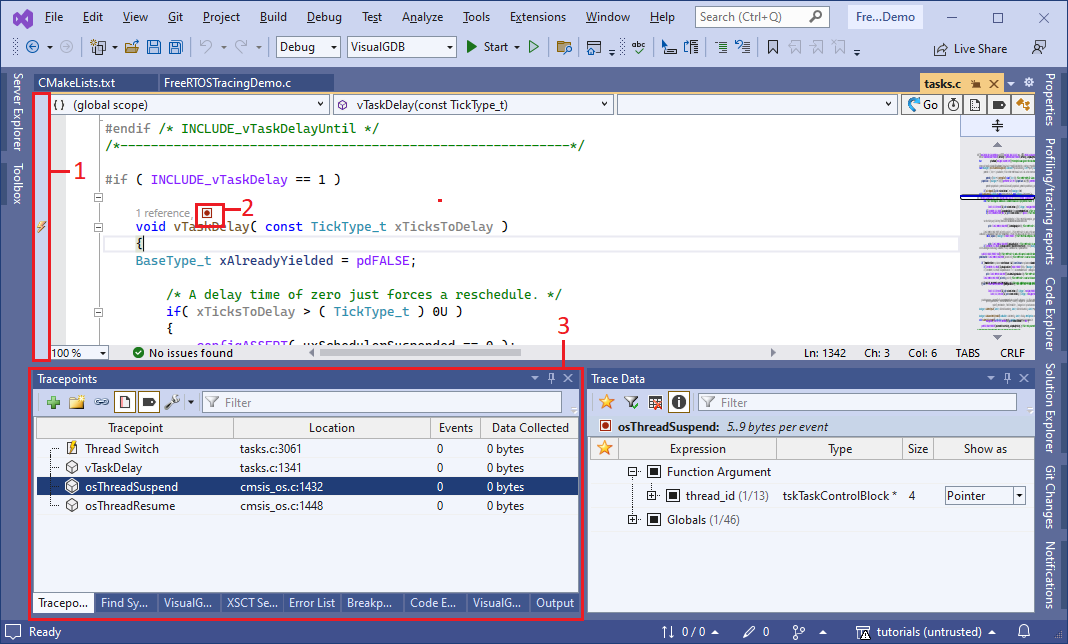
If your code runs from RAM, you can create tracepoints before, or at any time during the debugging session. If the code runs from FLASH, tracepoints need to be created before starting the debug session, however, you can initially create them disabled and then enable them during runtime.
Selecting Traced Data
You can configure which data to record by right-clicking in the tracepoint bar or selecting a tracepoint in the Tracepoints window and opening the Trace Data window: 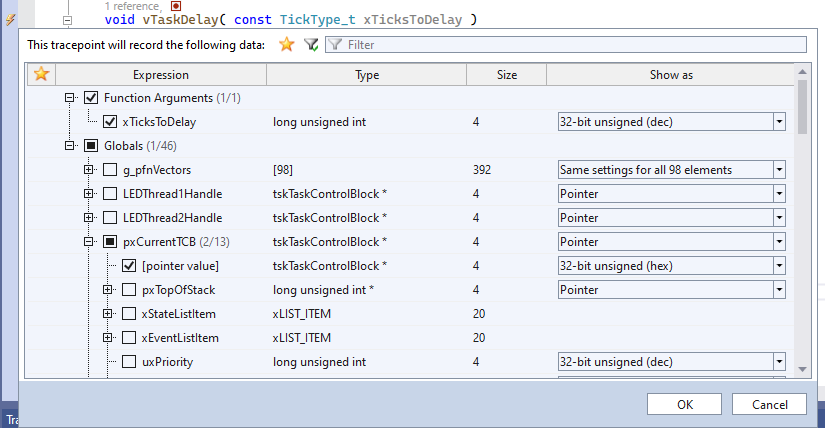 You can enable/disable tracepoints and change the data they are recording at any time, as long as you have reserved some RAM for dynamic trace programs.
Viewing Traced Data
You can view the events produced by the tracepoints via the Tracepoints window, and check the data recorded for each event via the Trace Data window. Viewing the recorded event data uses the Live Memory interface and does not stop the target.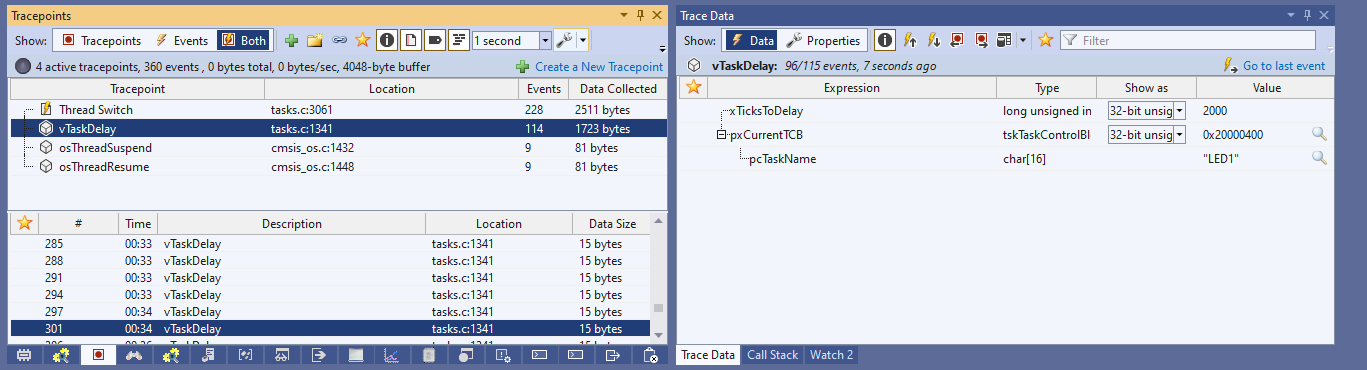 You can also navigate the tracepoint events and view the recorded data via the tracepoint annotations in the code:
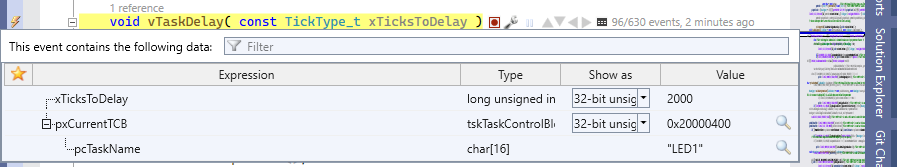
Data Views
You can display the data from multiple events as a table or a graph by creating a data view: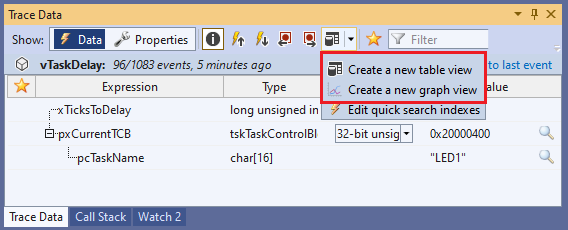 Drag the data items from the Trace Data window into the column definition area to automatically create table columns for these items:
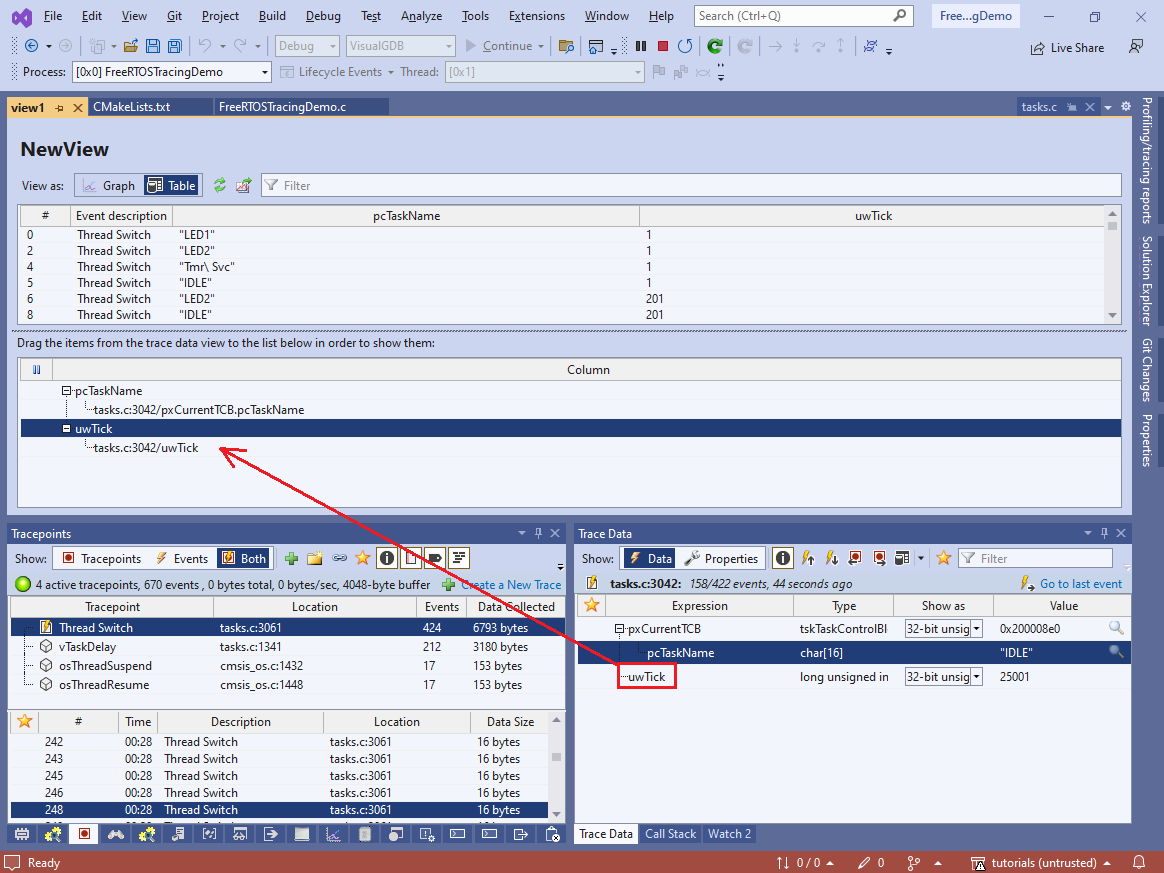
Running via Command Line
You can run your application on the device and generate tracing reports without having to open Visual Studio via the following command line:
VisualGDB.exe /trace <file.vgdbcmake or file.vgdbsettings> /traceconfig:<tracepoints.xml> /tracereport:<report.tracereport> /xmltracereport:<report.xml> |
The tracepoint configuration file can be obtained by selecting one or more tracepoints in the Tracepoints window and clicking “Export to file”.
If you are using Advanced CMake, you would need to explicitly specify the relative path to the executable produced by CMake, e.g.:
/targetpath:build\VisualGDB\Debug\MyApplication |
The trace reports produced via command line can be opened via File->Open in Visual Studio and replayed as usual. The XML trace reports cannot be replayed directly, but can be used to analyze the traced data programmatically.
Settings
You can configure tracing settings via VisualGDB Project Properties -> Software Tracing: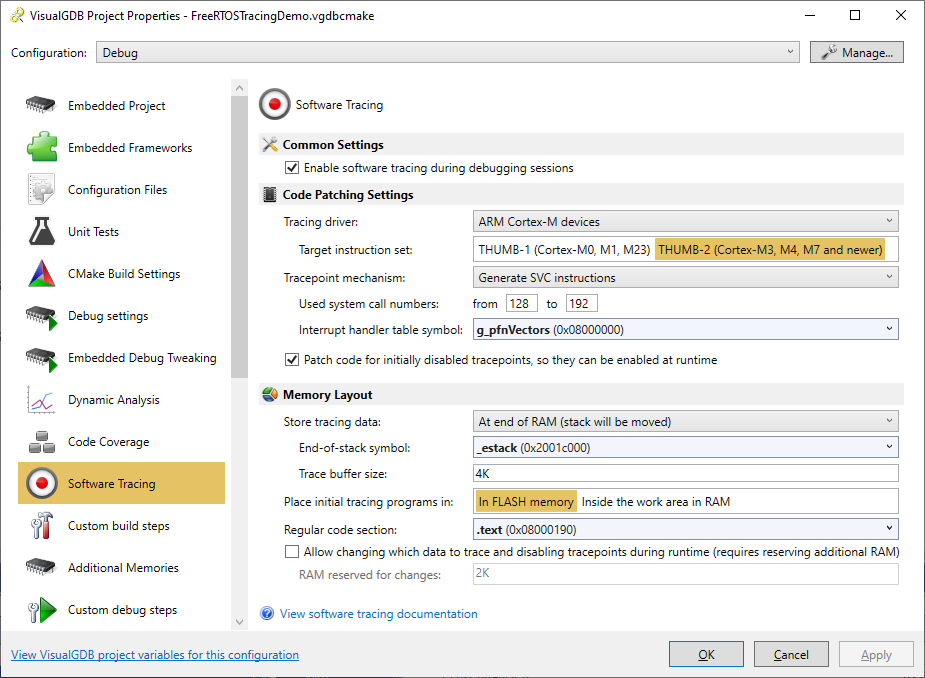
Code Patching Settings
On ARM Cortex-M devices the tracing is implemented by injecting the SVC instructions into the traced locations, and hooking the original system call handler. Whenever a tracepoint is executed, the following events take place:
- The SVC instruction invokes the SysCall handler provided by VisualGDB.
- The SysCall handler checks the syscall number and locates the generated tracepoint program for that tracepoint.
- The tracepoint program records the selected data, emulates the intercepted instruction, and returns control.
- If the SVC call did not originate from a known tracepoint, the tracing SysCall handler invokes the original handler.
In order to properly handle this instrumentation, VisualGDB needs the following parameters:
- The address of the interrupt handler table. It is used to replace the original Syscall handler.
- The range of syscall numbers to use. It is used to speed up locating the tracepoints.
If your program does not use system calls, you can proceed with the default syscall range, or reduce it to save some RAM (4 bytes per syscall slot). If your program uses system calls, it is recommended to select a syscall range that does not overlap with the already used syscalls.
The syscall range setting is flexible – if you select fewer syscalls than you have tracepoints, VisualGDB will automatically share them (slightly increasing runtime overhead). If you accidentally select a syscall range that is already being used by the program, the tracing logic will sort it out, but the overhead per syscall will increase.
Memory Layout
In order to facilitate tracing, VisualGDB needs to inject 3 kinds of entities into the program:
- The circular buffer used to store the tracing data.
- Static trace programs created before the program started.
- Dynamic trace programs, created when you enable/disable a tracepoint, or change which data it should trace.
The tracing work area (containing the circular buffer) can be placed in 3 different ways:
- At the end of RAM, where the stack previously was. This will move the initial stack pointer to a lower address so that it won’t corrupt the tracing data.
- In order to use this option, you need to select the correct end-of-stack symbol. It is typically called _estack or __StackTop.
- After the last global variable, but before the heap.
- In order to use this option you would need to select the correct end-of-data-section symbol that is used to determine the heap location. It is typically called end.
- In an existing pre-defined variable.
The first 2 options work on existing ELF files and do not require rebuilding them. They have been tested with STM32Cube, MCUXpresso, MBED and NRFConnect frameworks. The last option can be used as a fallback if other options don’t work. Simply add the following code to your program:
volatile char g_TracingData[<SIZE>] = {1, }; int main() { volatile int x = g_TracingData[0]; //... } |
This will place all tracing logic inside the g_TracingData variable where it won’t interfere with other parts of the program.
Initial Tracing Programs
In order to preserve RAM, VisualGDB can place the initial tracing programs (i.e. tracepoints created before starting the session) into the FLASH memory. It will automatically place them after the last code section. If you do not wish to do it (e.g. have a custom data area there), you can place them inside the regular work area next to the circular buffer.
Dynamic Tracing Programs
If you are planning to change some tracepoints while the program is running, you need to reserve some RAM space for the corresponding tracing programs. It will be subtracted from the amount of RAM used by the circular buffer.
Disabled Tracepoint Behavior
If you start a tracing session with some tracepoints disabled, VisualGDB can do one of the following:
- Completely ignore them, as it they were not present. It will not produce any runtime overhead, but you won’t be able to enable them at runtime.
- Patch their locations, but do not record any data. It will result in slight runtime overhead (running the syscall handler and emulating the original instruction), but you will be able to enable them at runtime, as long as you have reserved some RAM for the dynamic trace programs.