10 Powerful Debugging Tricks with Visual Studio
This article describes 10 most time-saving features of Visual Studio debugger that can be used for debugging any application with Visual Studio.
1. Hover mouse to evaluate expression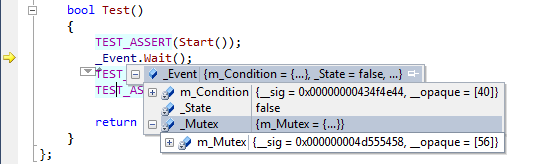
Debugging can be challenging. Stepping through a function to understand what went wrong, looking through the call stack to see where did that value come from… In either case adding watch expressions or looking through a list of locals can take quite a time. However, things get easier if you just point your mouse at a variable of interest. Moreover, classes and structures will be expanded with one click, allowing to find the field you need quickly and conveniently.
2. Change values on-the-fly
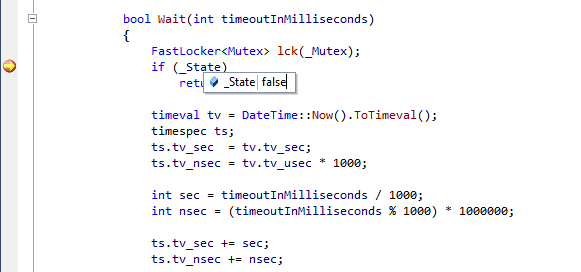
Debugger is much more than a tool for analyzing crashes and wierd behavior. Many bugs can be prevented by stepping through a freshly written function and checking that it behaves as expected. Sometimes you are curious “would the function behave correctly if this condition was true?”. And in most cases it does not mean changing the code and restarting. Just hover the mouse over a variable, double-click at the value and type in the new one!
3. Set next statement
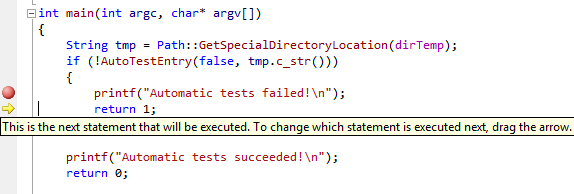
One typical debugging scenario is analyzing why does a function call fail by going through the function step-by-step. And what do you do when you’ve just discovered that a function called another function that returned an error? Restart debugging? There’s a better idea: just drag the yellow statement marker to the line you want to be executed next, like the function that has just failed, and then simply step in. Simple, isn’t it?
4. A convenient watch window
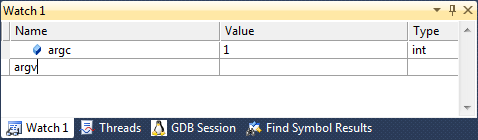
Probably, every modern debugger has a watch window. However, what’s really cool about the Visual Studio one is how easy you can add and remove variables there. Just click at the empty line, type your expression and press Enter. Or simply press delete button to remove an expression that is no longer needed.
5. Annotated disassembly
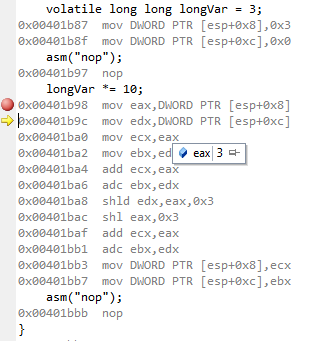
Optimizing the performance of the critical parts of your program can be much easier using the interactive disassembly mode. Visual Studio shows you the instructions corresponding to every line of your code and allows running the code step-by-step, as well as setting breakpoints at arbitrary locations. And, of course, the expression evaluation and modification will work just like for the C++ code.
6. Threads window with stacks
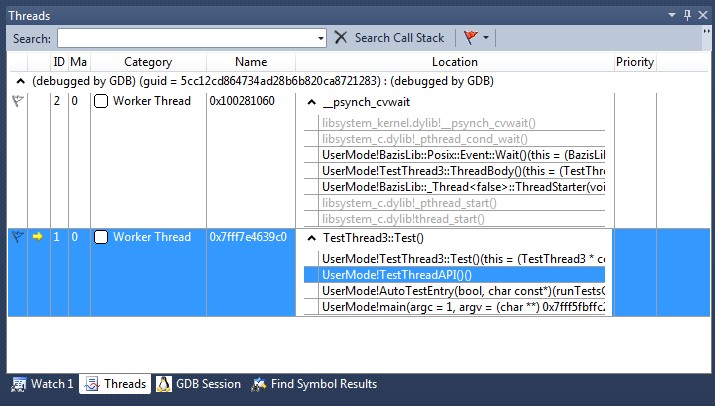
Debugging multi-threaded applications can be painful. Or it can be fun. Depends on your debugger. One really nice feature of Visual Studio 2010 is the stack view in the threads window. You can get a convenient overview of all your threads and navigate through their call stacks directly from the window. The screenshot above shows 2 threads of a MacOS application. One of the threads is waiting for an event.
7. Setting breakpoints on-the-fly
Another minor but nontheless timesaving feature of Visual Studio is the ability to set and remove breakpoints while the program is running. VisualGDB supports it by seamlessly stopping the debugged program when you insert or remove a breakpoint and resuming it immediately after. Furthermore, the Enterprise edition allows customizing the method that VisualGDB should use to stop the target (e.g. sending an interrupt command or running a custom script).
8. Memory window
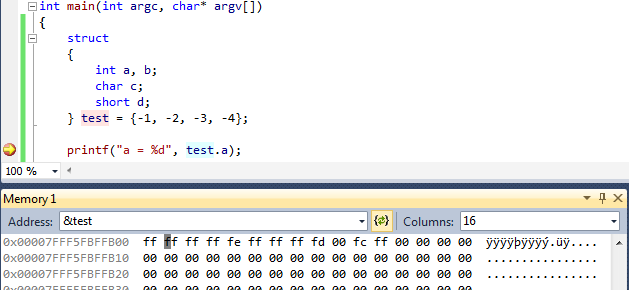
Some bugs are caused by incorrect structure definitions, missing alignment attributes, etc. Seeing the raw memory contents simplifies locating and fixing those bugs. Visual Studio features a convenient memory window that can interpret the values as 8/16/32/64-bit numbers, as well as floating-point numbers and allows changing them on-the-fly by simply typing the new values over the old ones like in a text editor.
9. Conditional breakpoints
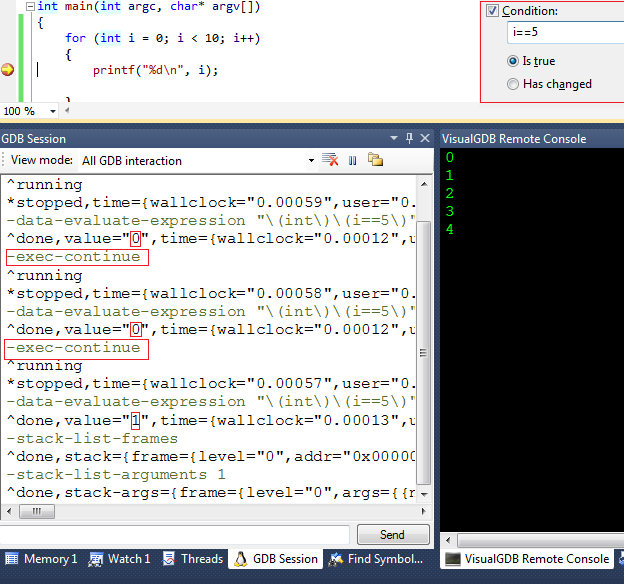
If you’re trying to reproduce a rare event and getting too many false positives with your breakpoints, you can easily make them conditional! Simply specify the condition for a breakpoint and Visual Studio will automatically ignore the breakpoint when the condition does not hold. The screenshot illustrates how VisualGDB queries the expression value and immediately resumes the execution when the condition is false.
10. Go To Definition
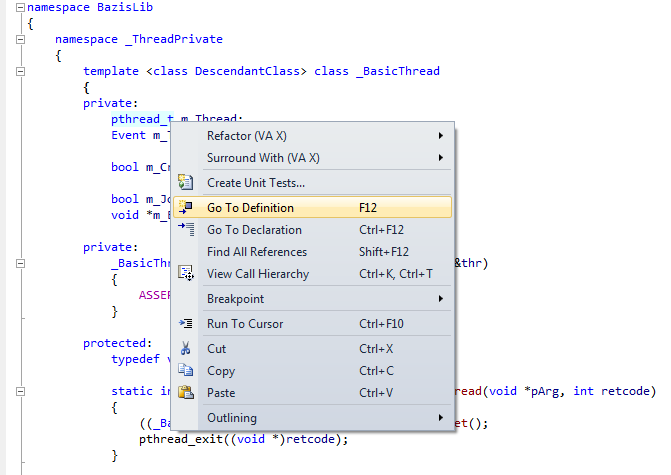
One last feature to mention is not directly related to debugging, rather to exploring big projects. If the IntelliSense paths are set correctly (VisualGDB does it automatically for GCC-based toolchains), you can easily find the definition of a type, variable, function or a preprocessor macro by right-clicking at it and selecting “go to definition”.